
Just as one swallow does not make a summer, a below average rainfall year does not mean the climate has changed.
But it’s a warning sign. We need to take notice.
Tasmania’s hydro-dominated power system has long been at the mercy of rainfall. History shows a pattern: every two or three decades, severe droughts have tested the limits of the state’s storages, forcing emergency measures and reshaping energy planning.
- 1950s drought: Triggered widespread power restrictions and accelerated plans for construction of additional hydro power stations.
- 1967 drought: The prolonged drought of 1967 proved a watershed moment, creating such severe hydroelectricity shortfalls that the Hydro-Electric Commission was compelled to construct an oil-fired power station at Bell Bay—marking the system’s first major departure from pure hydro generation.
- 2006–08 drought: This drought saw Hydro Tasmania’s water storages plummet to levels not witnessed since the 1960s, demonstrating that despite decades of system development, fundamental weather-dependency vulnerabilities remained.
- 2015-16: The perfect storm Described as a record low spring rainfall event, this drought coincided catastrophically with a 176-day Basslink cable outage. The combination created what Hydro Tasmania executives termed a one-in-3000 year event, necessitating the rapid deployment of diesel generators to prevent system collapse and prompting a fundamental reassessment of energy security planning.
Each crisis reinforced a basic truth: hydro alone can’t guarantee security. The state has always had to supplement with rationing or thermal generation when nature turns off the tap.
The 2015/16 event forced a rethink of energy security planning. Hydro Tasmania now has contingency measures in place, including the rapid deployment of diesel, to strengthen resilience.
However, on 29 August 2025, Hydro Tasmania chief executive officer Rachel Watson stated in an ABC radio interview, “We are on the second year of the worst multi-season drought that’s been recorded in Tasmania’s history“.
Since the Basslink outage energy security and storage levels have been given greater scrutiny by the Office of the Tasmanian Energy Regulator’s (OTTER). It publishes monthly information and provides an annual report Energy in Tasmania. It reports hydro inflows on a water year basis which ends at the end of October when spring rains traditionally top up storage levels for the year ahead.
The 2023/24 report for the year ended 31st Oct 2024 covered the first year of the latest drought. Average rainfall based on figures from 1997/98 onwards were 9,022 GWh. The low inflow scenario, a worst case assumption was reported as 6,510 GWh, which is calculated as two standard deviations from the average. This means there is a 95.45 per cent chance inflow will fall in the range within two standard deviations of the average. The following chart presents this:
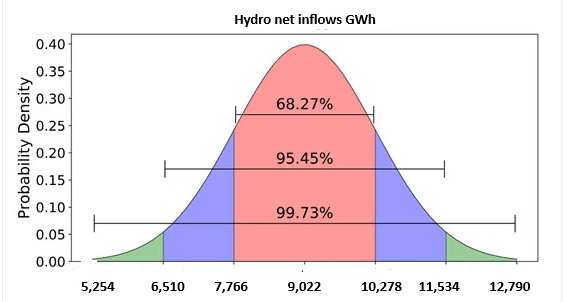
The inflow figure for the 2023/24 water year was 6.645 GWh. Alarmingly in the current 2024/25 water year inflows after 11 months are below that figure, although October rains are likely to result in an annual figure showing little change.
This is what Hydro Tasmania’s CEO meant by the worst multi-season drought that’s been recorded in Tasmania’s history, rain almost two standard deviations from normal two years in a row.
The deeper realities run beyond crisis management. We may be seeing either the start of another cyclical dry spell or a more fundamental shift in climate. Either way, Tasmania cannot assume the old hydro paradigm will hold forever.
As we prepare for Marinus to solve all our problems is it predicated on a false set of assumptions? How much notice should we take of the swallow which visited us in the 2024/25 year. There were only a few weeks of 2024/25 when our local electricity needs could be met from local production.
The following chart, and those that follow, tell the weekly story of electricity production and consumption in Tasmania. The chart is constructed from information provided by) OTTER, plus Australian Energy Regulator (AER) report on NEM electricity consumption:
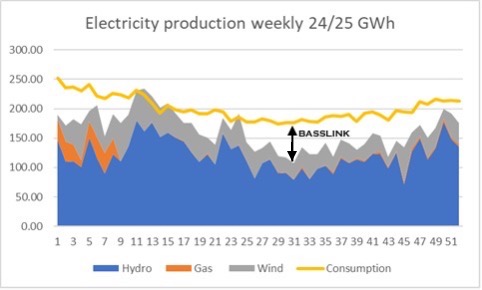
For most of the year we didn’t produce enough electricity to meet our needs. The line shows weekly consumption, approximately 200 GWh per week. Of particular note, is the consumption fall during summer and the overall downward trend. Consumption in June 2025 was noticeably less than a year earlier. Overall, the annual total was 10,460 GWh. Only during weeks 10 to 15 (Sept/Oct 2024) was local production (hydro, wind and small amount from gas) enough for our needs. Hydro supplied only 6,330 GWh for the year, the lowest on record for the hydro system as currently configured. The rest of the 2024/25 year imports via Basslink were needed. The following chart shows the weekly Basslink imports and exports:
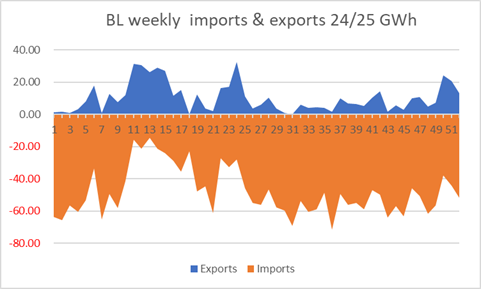
There were a few Basslink exports (532 GWh) but with imports of 2,509 GWh, net imports were almost 2,000 GWh which was needed to supplement local hydro and wind production.
It is instructive to look at three years earlier, the 2021/22 year. For a 6 month period from week 20 to week 44, local production was also insufficient to meet local needs. Basslink imports were needed. Consumption was higher totalling over 11,000 GWh for the year. Hydro production was 9,560 GWh slightly more than the figure long considered to be the average hydro system yield. Net inflows were slightly less which meant dam levels fell by about 300 GWh.
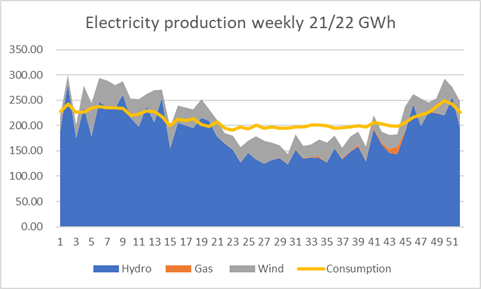
The pattern of imports and exports in the 2021/22 year are shown below:
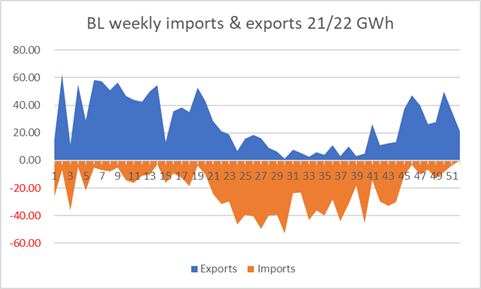
The chart confirms net imports over the summer months and net exports for the rest of the year, a traditional pattern. Exports were 1,400 GWh and imports 1,160 GWh so there was about 240 GWh of net exports. If Basslink was not a component of the system at this time, the land based Tas wind and hydro system would have been broadly in supply and demand balance.
Comparing the 2021/22 year to the 2024/25 year , in the former year imports were in balance with exports however, in the latter year 2,000 GWh of imports were needed. Post Marinus, such a shortfall could be made up by a combination of Basslink imports, Marinus imports and additional Tas based generation (Tarraleah and new Wind). To help get this into perspective 650MW of wind generators are needed to produce 2,000 GWh of electricity each year. Current installed capacity at Woolnorth, Musselroe, Granville and Cattle Hill is 558 MW.
Are the rivers of gold that are predicted to flow from Marinus exports based on risky assumptions? If drought conditions are a more regular feature impacting the hydro generation system in Tasmania, will Marinus need to be relied upon for significant imports rather than the current assumption of lucrative exports? Has Hydro Tasmania been caught napping in its primary focus on an energy trading business at the expense of needing also to focus on its Tasmania based generation options?
Rather than drawing too many conclusions from the first swallow, moving 10-year averages are less prone to fluctuations. In the last five years the rolling 10-year average for both hydro inflows and hydro production have both fallen by around 9 per cent, down from around 9,300 GWh per year production to 8,500 GWh per year.
The WoSBC has a footnote stating the hydro system was assumed to produce 8,300 GWh each year. We’re almost at that point already. Marinus is predicated on the current drought ending soon and ‘normal’ patterns of rainfall resuming.
Our future, not just Marinus, but the State itself is dependent on the rain gods. That has always been the case given the dominance of our hydro based system and the need for prudent risk management to minimise those risks. But is that risk profile becoming more adverse and will significant levels of Marinus imports ultimately need to be part of the answer?
The other disquieting feature of the post WoSBC discussion, or non-discussion might be more accurate, was the revelation that an Australian Energy Regulator AER determined fee for the additional transmission network, the NWTD, would be insufficient to enable repayment of the debt required to built it. Previously most assumed that if the value of the Regulated Asset Base (RAB) accepted by AER was roughly the same as what it cost to build, then the regulated fee would enable payment of the debt before the end of the asset’s life. NWTD is funded by Australian government concessional finance and it is unclear what the terms of that loan are; similarly, it is unclear what the recently agreed additional Australian Government Grant of $346 million to reduce the regulated asset base across TasNetwork’s transmission network will have. When infrastructure becomes too expensive for regulated fees to service we have a big problem.
This pre-empts a closer look at our transmission network. The Transmission system in Tasmania is designed for the reality of the Major Industrials (Mis) consuming more than half of Tas total electricity consumption. This reality becomes apparent in the following data.
If we take a look at the electricity delivered across the NEM in 2024/25:
| NEM consumption TWh 2024/25 (1 Terrawatt = 1000 Gigawatt) | |||
| NSW incl ACT | 67.6 | ||
| Vic | 44.0 | ||
| Queensland | 56.3 | ||
| South Aus | 11.8 | ||
| Tasmania | 10.4 | ||
| Total | 190.1 | ||
Tasmania’s electricity purchases from the NEM were 10,400 GWh confirming the earlier observation. At first glance this is a disproportionately large amount for a State the size of Tasmania. The following snapshot puts it into perspective, comparing Tasmania with say Victoria and South Australia.
| Size relative to Tas (x times) | Vic | SA | |
| NEM consumption | 4.2 | 1.1 | |
| Gross State Product | 15.1 | 3.6 | |
| Per capita | 12.2 | 3.2 | |
Victoria consumes 4.2 times more electricity than Tasmania, yet its economy is 15.1 times larger and there are 12.2 times as many people living there. In the case of South Australia the population is 3.2 times larger than Tasmania and the economy is 3.6 times larger , yet it uses only 1.1 times as much electricity. In other words, it only uses 10 per cent more than we do.
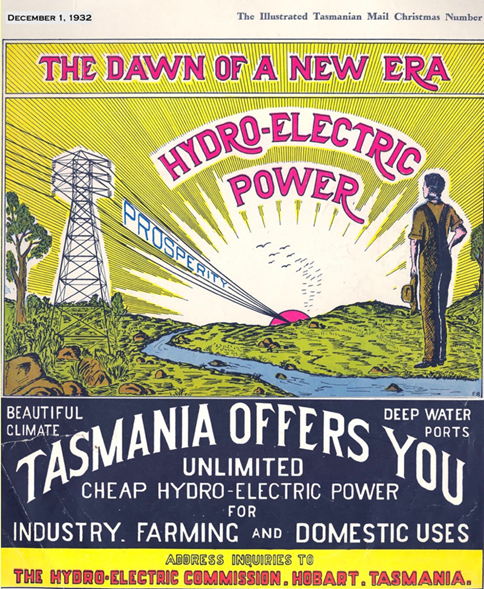
The reason of course is the dominance of MIs in Tasmania where the four largest users comprise 55 per cent of local demand. MIs were attracted to Tasmania because of cheap power. In the old days when Tasmania was off-grid, so to speak, before the Basslink interconnector, electricity was either cheap or it didn’t cost a lot to easily produce a bit more. Provided it could then be sold to cover marginal costs, the extra costs of production, it made sense to attract MIs. Spill over employment effects were welcomed and spill over costs minimised or ignored. A picture is worth a thousand words:
However, interconnection is antithetical to being off the NEM grid when developing and supporting local industry by selling the abundant electricity at marginal cost made sense. The degree to which we can resolve the fundamental conflict between greater interconnection and subsidising local industry is the problem we have yet to seriously tackle. Every decision that’s made, whether to offer discounted electricity or to buy electricity from new generators, has a direct measurable cost for Tasmanians, because interconnection provides an alternative market. Yet the subject of hidden subsidies is a taboo subject. We’re stuck with an industry structure designed in a different era. Inertia wins every time.
If the major industrial companies ultimately exit the State, the burden of paying for the over-sized transmission system will be transferred to the remaining customers.
When the transmission company Transend was spun off from Hydro in the late 1990’s it was debt free. Today, TasNetworks which took over Transend is the most indebted of our publicly owned businesses, in part due to $270m of debt and equity transfers from Transend to Hydro Tasmania in 2009/10.
Historically, the hydro system’s strategic intent was clear: attract major industrials (MIs) with cheap, reliable power. That model delivered decades of jobs and growth. But the economics are shifting. International competition and rising energy costs mean smelters and heavy users may no longer enjoy the same advantage. NSW’s Tomago aluminium smelter, now renegotiating supply with AGL and the NSW and Australian Governments, shows Tasmania is not alone in facing these pressures.
Tasmania’s transmission system still reflects the dominance of MIs – they consume about half the state’s total electricity. But as the future of these industries becomes less certain, the infrastructure, pricing, and planning models tied to them face serious questions.
The challenge is not only technical but strategic: how to adapt an energy system – and an economy – built on past assumptions to meet a far less predictable future.
Tasmania faces a complex future where traditional economic drivers may become less viable due to changing energy economics, while the state grapples with significant debt and the ongoing reality of climate-dependent power generation. The historical 20-30 year drought cycle, combined with potential climate change impacts, demands continued innovation in energy security planning while preserving the industrial foundation that has underpinned the state’s development.
The challenge lies in maintaining system reliability and economic competitiveness as global energy markets evolve, ensuring Tasmania’s unique hydro-dependent system can adapt to both familiar cyclical challenges and unprecedented future conditions.
At a time of massive changes in the electricity industry our fortunes are being decided in the back rooms without adequate public discussion or understanding. The challenges facing both generation and transmission in Tasmania are profound and to date a clear exposition of our current situation has never been provided.