

This twelfth post continues a series of four Chapters 10-13, related to the financial position of Hydro Tasmania with a focus on the Hydro’s cash flow. This is critical to understand the changes in the energy sector and how Hydro Tasmania actually earned money in the past, present and future, how the National Electricity Market shapes its fortunes, and why the numbers in its accounts now matter more than at any time in the past two decades. It also seeks to dismantle the myths that have dominated public debate.
I thank John Lawrence for his assistance in preparing this information, his attention to detail and research over many years as we have worked together to better understand one of the most complex areas that impact our state, economically and functionally.
Glossary of acronyms used in this chapter
AEMO – Australian Energy Market Operator: Runs the NEM, dispatches generators, manages system security, and publishes key planning documents.
IRR / IRRs – Inter‑Regional Revenues / Inter‑Regional Residues: The financial mechanism that captures price differences between NEM regions. Historically a major windfall for Hydro.
LGC – Large‑scale Generation Certificate: A renewable energy certificate created for each MWh of eligible renewable generation.
MI – Major Industrials: There are four – Bell Bay Aluminium, Temco, Nyrstar and Norske Skog who consume 55 per cent of the State’s electricity via contracts with Hydro.
Hydro Tasmania – Cash Flow -The Final Test of Hydro’s Financial Strength
If underlying profit shows how Hydro performed this year, and the balance sheet shows how much risk it is carrying into the next, then the cash flow statement answers the most important question of all: is Hydro generating enough real money to sustain itself? Cash is the one number that cannot be massaged. It determines whether Hydro can pay its bills, service its debt, fund its capital program, withstand drought, and continue contributing to the State Budget.
Hydro’s statutory cash flow statement is dense, but once you strip out subsidiary noise and focus on the parent company, the entity that owns the hydro system, carries the debt, and bears the risk, ignoring a couple of minor transactions with subsidiaries, the picture becomes much clearer. And once the numbers are laid out side by side, the story they tell is unmistakable.
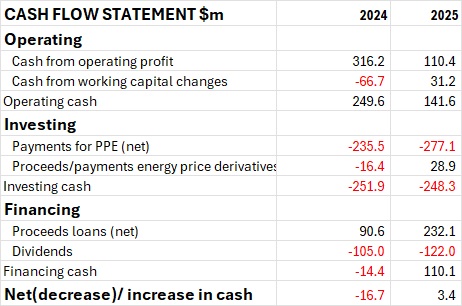
With the table above, the first thing that stands out is the sharp fall in operating cash. In 2023/24, Hydro generated almost $250 million from operations. A year later, that figure had fallen to just $142 million. The decline mirrors the collapse in underlying profit: less generation, lower derived prices, structural Large Generation Certificate (LGC) losses, and higher settlement costs all flowed directly into weaker operating cash.
The first step in understanding operating cash is to reconcile it with underlying profit, as discussed in Chapter 10. Adding back non‑cash items – almost all of which is depreciation of $124 million – converts the underlying loss of $15 million into $110 million of cash generated from operations before working‑capital changes.
The second step is to understand movements in working capital. In 2023/24, working‑capital changes reduced cash by $67 million. In 2024/25, they increased cash by $31 million. These movements often swing from year to year because they reflect timing differences rather than performance. Receivables rose in 2024/25, probably because IRRs, LGC sales, and MI settlements were booked as revenue but not yet received in cash. Payables increased, likely because Hydro slowed outgoing payments to preserve liquidity. Prepayments unwound. These movements improved operating cash, but they are not signs of strength; they are signs of a business managing timing to get through the year.
The largest single contributor within working‑capital changes, however, was the cash effect of Hydro’s LGC position. While the LGC losses recorded in underlying profit totalled $64.5 million (as calculated in Chapter 6, driven by the write‑down of inventory), the actual cash impact was $37 million – an outflow that sits inside working‑capital movements rather than operating profit. The difference explains most of the working‑capital contribution to operating cash.
The second thing the table makes clear is that Hydro’s capital needs did not fall with its profit. Capital expenditure rose to $277 million, reflecting the ongoing cost of maintaining ageing assets, upgrading turbines, investing in digital control systems, and meeting environmental and safety obligations. These are not optional expenses. They are the price of keeping the hydro system running. Even in a difficult year, Hydro cannot defer them indefinitely.
The third element in the table – and the one that often causes confusion – is the line showing proceeds and payments from energy price derivatives. These are real cash movements, not accounting entries. They arise when Hydro closes out or adjusts hedge positions early, either to lock in a gain, cut a loss, or respond to hedge positions not required due to changed circumstances. It’s impossible to know for sure. In 2023/24, Hydro paid $16 million to exit unfavourable positions. In 2024/25, it received $29 million from closing out profitable ones. These movements reflect Hydro’s risk management decisions in a volatile market. They are not the cause of Hydro’s financial stress, but they do reveal the pressures the business was under.
The final section of the table – the financing flows – tells the rest of the story. Hydro borrowed $232 million in 2024/25. Without that borrowing, it could not have funded its capital program, met its settlement obligations, or paid the $122 million dividend owing from the previous year.
The statutory snapshot at 30 June shows a large unused portion of Hydro’s $1.5 billion TASCORP borrowing limit, but this is misleading. It reflects a single day, not the pattern across the year. In reality, Hydro almost certainly drew on that facility repeatedly to manage liquidity swings – paying the Australian Energy Market operator (AEMO) before major industry (MI) customers paid Hydro, covering LGC purchases before LGC sales settled, and smoothing the timing mismatch between IRR accruals and IRR receipts. The facility is functioning as a working‑capital buffer, not a strategic reserve.
When you read the table as a whole, the pattern is clear. Hydro’s operating cash fell sharply. Its capital needs remained high. Its working capital is complex. It was manageable during 2024/25 but the rising level of liabilities identified in Chapter 11 suggest life won’t get easier. And its liquidity was maintained only because it borrowed heavily. This is not a sustainable position for a business that underpins the State Budget. As it is, returns to Government in the next year or two will be much reduced. Whether amounts hoped for in the Forward Estimates will be achieved is highly problematic and unlikely.
Cash flow is the final test of financial strength because it cannot be disguised. It is the number that determines whether Hydro can withstand another dry year, whether it can absorb the loss of Inter-Regional Revenues (IRRs), whether it can continue making profits and paying dividends to support the state’s fiscal position. In 2024/25, that number was weak – and the gap was filled with debt.
The next chapter brings together these three strands – underlying profit, the balance sheet, and cash flow – to show the full picture of Hydro’s financial position. It is only when these elements are viewed together that the scale of the challenge becomes clear.